School-Wide Trends
Written By Christopher Lee
Last updated 11 months ago
Knobase includes a powerful analytics dashboard that helps school leaders, teachers, and IT teams uncover meaningful patterns in student engagement, AI usage, and learning preferences. This feature transforms everyday interactions into actionable insights—supporting data-informed decisions across academics, well-being, and resource planning.

Click on “Analytics” on the dashboard
🧠 Why School-Wide Analytics Matter ✅ Reveals hidden trends in student interests and learning styles
✅ Helps educators identify gaps and tailor interventions
✅ Supports strategic planning for curriculum and enrichment programs
✅ Empowers schools to move beyond assumptions with real data
⚙️ How It Works
Aggregate Student Data
Knobase collects anonymized interaction data across all agents
Includes prompt types, usage frequency, time of day, and topic interests
Visualize Trends
Dashboards show patterns like:
Most discussed subjects
Common confusion areas
AI usage by grade level or time
Engagement with specific agents (e.g., Debate Coach, MUN Simulator)
Generate Reports
Quarterly reports delivered to school leaders
Includes summaries of student behavior, well-being flags, and academic focus areas
Make Data-Informed Decisions
Use insights to:
Adjust curriculum pacing
Expand popular programs
Allocate resources (e.g., reduce STEAM kits if interest is low)
Plan PD sessions based on teacher usage patterns
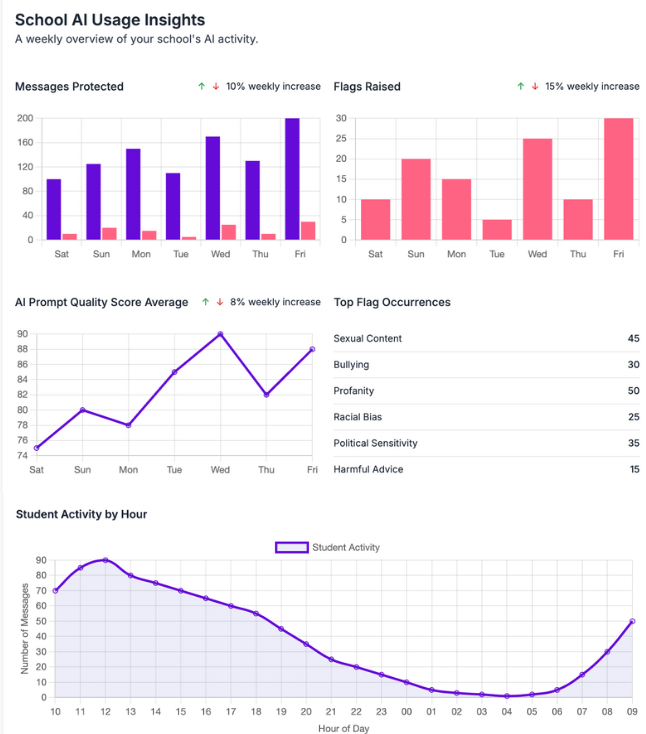
💡 Example: Engagement Insights
📌 Use Cases 🧑🏫 Teachers: Spot learning gaps and personalize support
🧑💼 Leaders: Strategize school-wide initiatives based on real needs
🧑🔧 IT/Admins: Monitor platform usage and optimize deployment
🔐 Privacy First All analytics are locally hosted and anonymized. Schools retain full control over data, ensuring compliance with privacy standards and ethical AI usage.